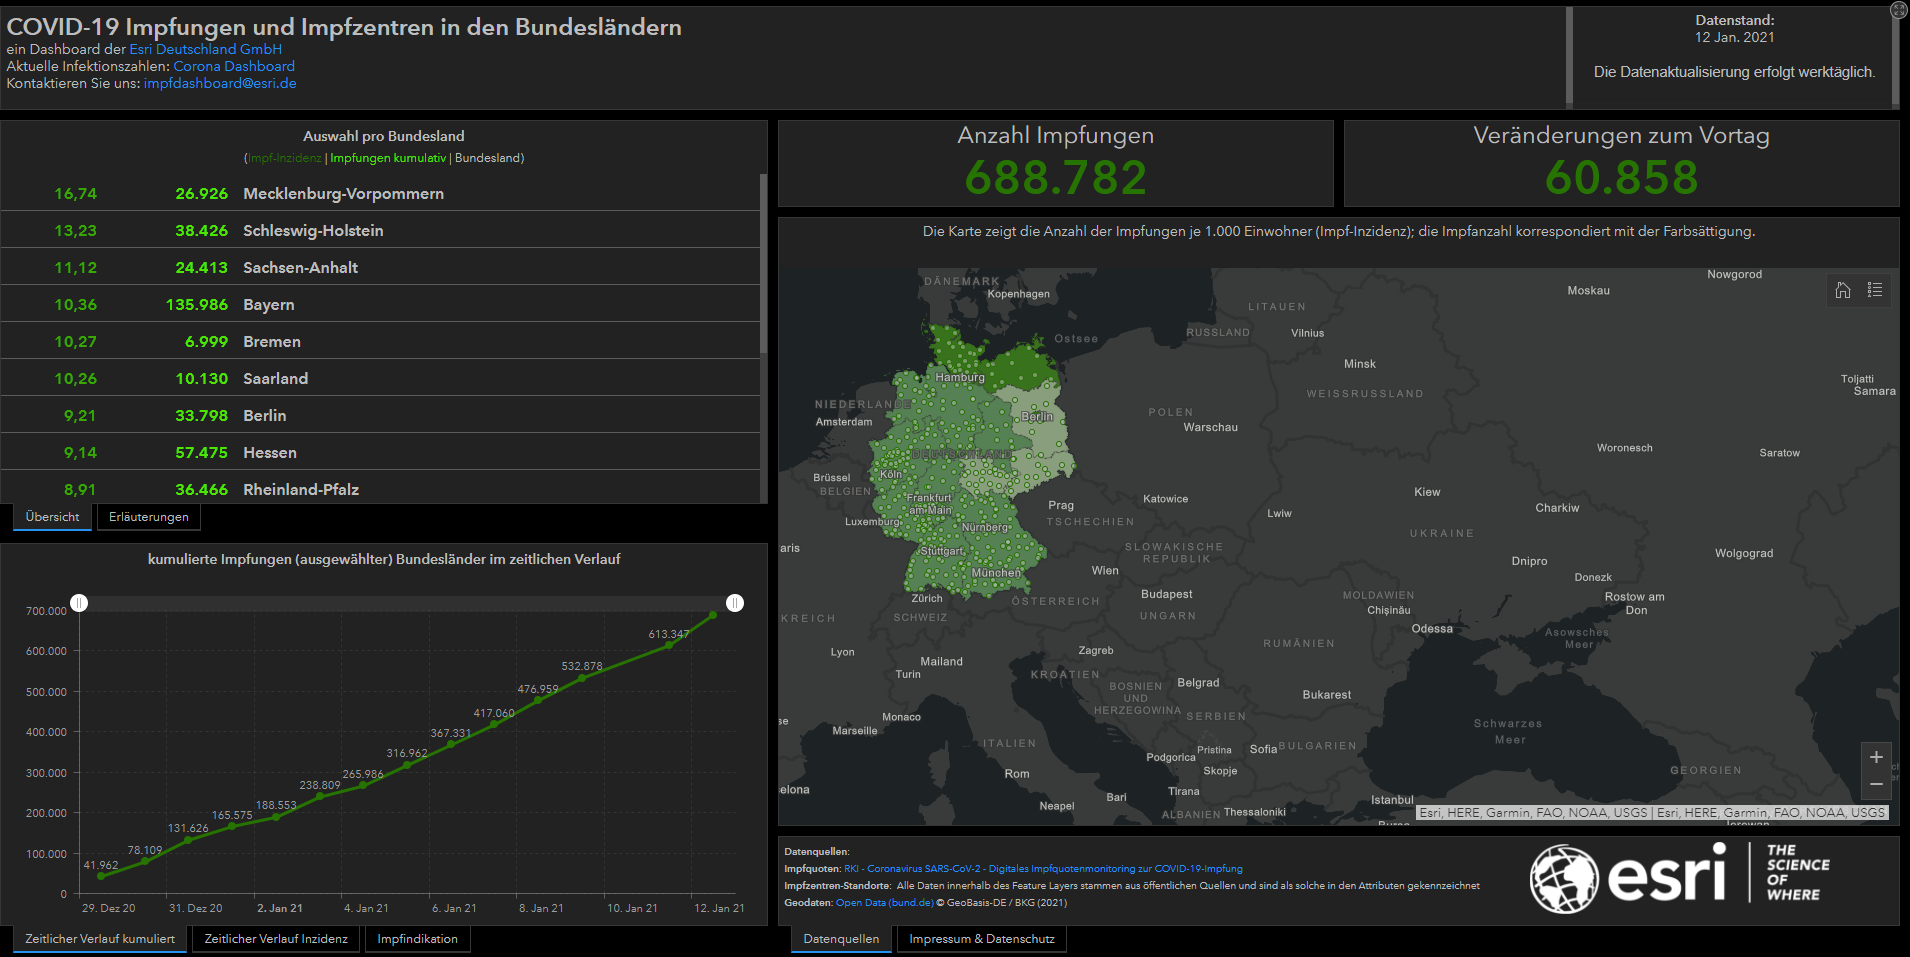
Based on data from the Robert Koch Institute, Esri Germany has published a dashboard (opens in a new tab) that visualizes vaccination progress in Germany on a daily basis. The interactive map shows how many people have already been vaccinated in which federal state. It also shows how the relative vaccination incidence compares to other federal states. The dashboard also contains additional information on the nationwide vaccination centers.
"Based on location intelligence technology, our interactive map helps to put all available data into a larger context. This makes it clear that Covid-19 vaccinations are currently at different stages of progress in the federal states. In order to be able to change this and enable an optimal distribution, it is helpful to compare the individual data sets in a visualized way. In this way, insights can be gained and the appropriate countermeasures initiated," explains Jürgen Schomakers, Managing Partner of Esri Germany-Switzerland.
Further information can be found at Esri Germany. (opens in a new tab)